


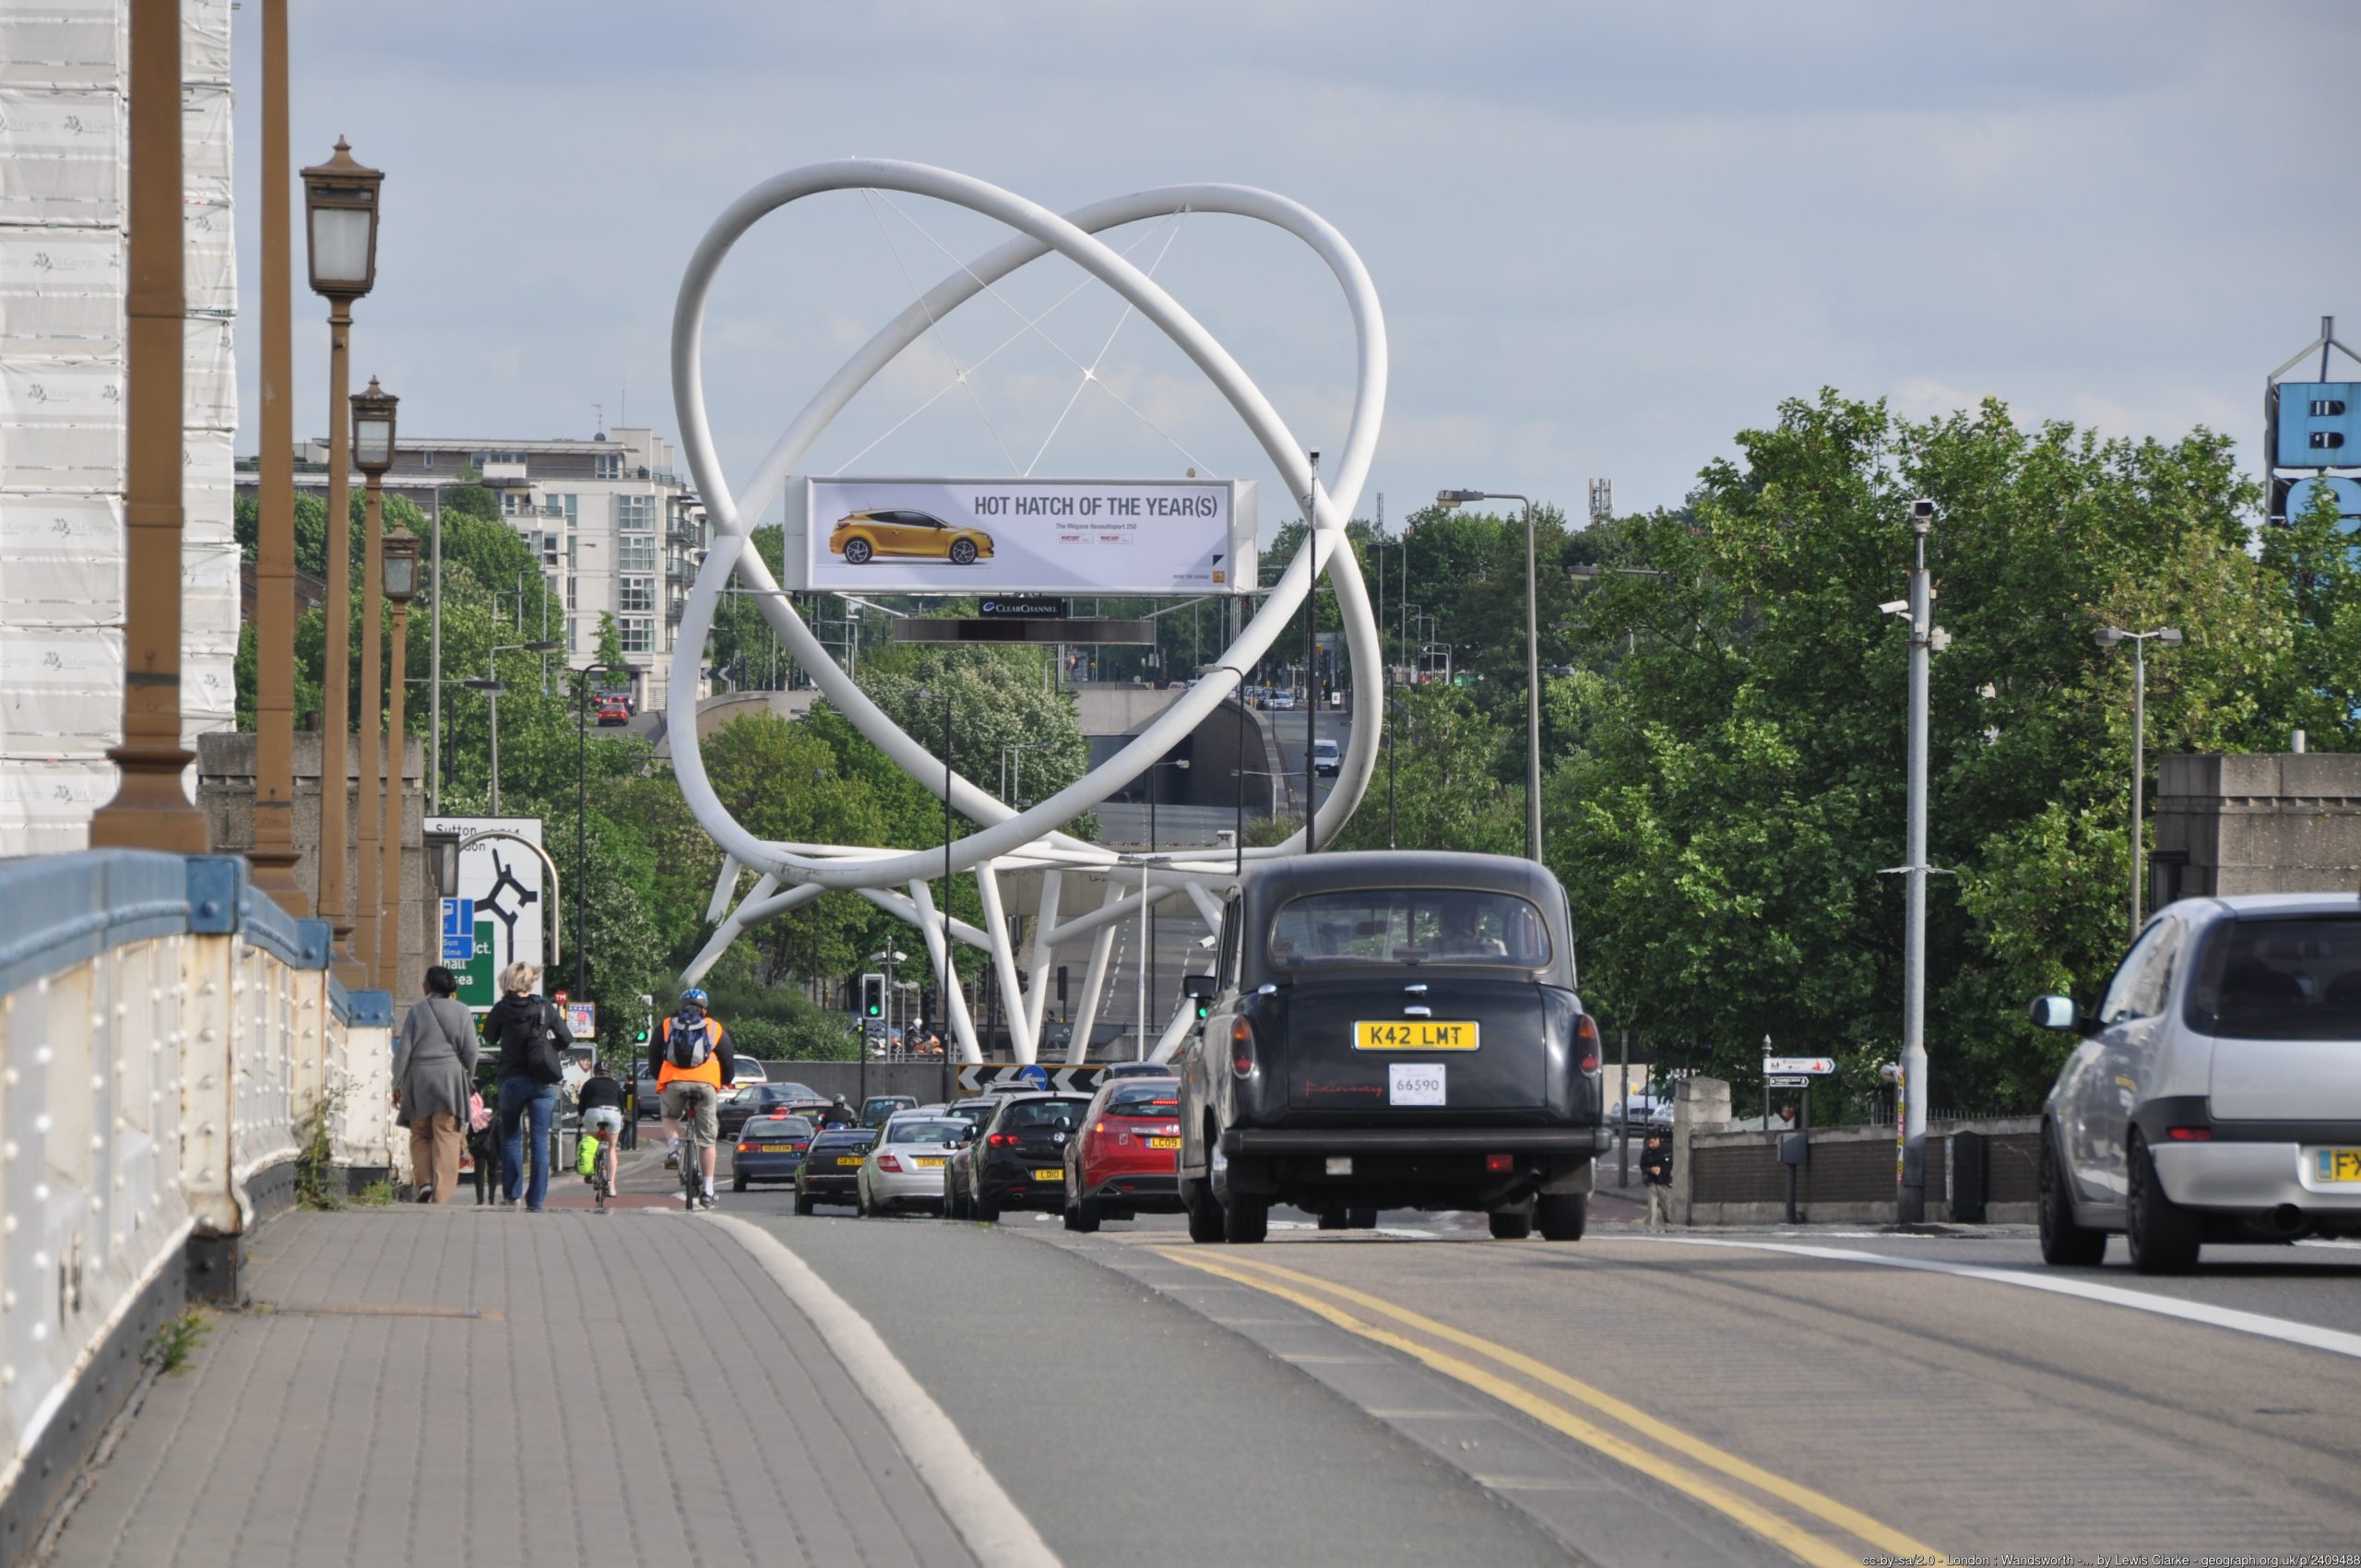
New analysis by Halfords shows that the London boroughs of Wandsworth and Barnet, and the cities of Edinburgh and Brighton, have the highest adoption rates of privately owned electric and hybrid vehicles in the UK.
According to the analysis by the UK's leading provider of motoring products and services, different parts of the country are adopting electric vehicles at dramatically contrasting rates, suggesting that an electric mobility divide, or ‘green gap’, may open up, with certain regions able to enjoy the benefits of low emission transport sooner than others.
The research has highlighted a positive correlation between the number of EV charging points and electric vehicle share, suggesting that local authorities should be redoubling their efforts to invest in charging infrastructure if they are to drive more widespread adoption.
However, a worrying sign has also come to analysts’ attention, which is that 66% of motorists say they are avoiding buying an electric vehicle in the next five years because of the prohibitive cost. The existing government Plug-In Grant for low emission vehicles currently offers 35% off the cost of the vehicle, up to a maximum of £3,000.
Halfords believes the grant is insufficient to encourage less well-off households to make the switch to electric, according to Andy Randall, Managing Director of Halfords Autocentres.
“What this research shows is that a more targeted approach to EV incentives may be required if the whole country is to join the green transport revolution,” he said. “This may mean introducing an element of regional targeting and means testing.”
According to Halfords’ analysis 1.6% of all privately owned cars in Wandsworth are electric or plug-in hybrid, making it the part of the country with the highest adoption rate. The overall average for London, is 1.03%.

Outside the capital, the highest rates for privately owned electric vehicles are found in Edinburgh and Brighton.
While electric and hybrid vehicles make up only a small proportion of the UK car fleet, the market is growing quickly. As we reported, November has been a great month for greener options as the market share for battery electric vehicles (BEVs) and plug-in hybrid vehicles (PHEVs) continued to grow significantly. A combined total of more than 18,000 new zero-emission capable cars joined Britain’s roads last month.
Following last month’s announcement, sales of new petrol and diesel vehicles must be phased out by 2030, with sales of some hybrids set to continue until 2035. However, research conducted by YouGov in October 2020 showed that the biggest barrier to switch to battery electric was the availability of charging points, with 62% of motorists saying it was a major consideration.
| Electric Cities league table (privately owned ULEV[*] share) | |||
| Rank | City | Privately owned ULEV share | Privately owned ULEVs aggregate |
| 1 | Wandsworth | 1.60% | 1,465 |
| 2 | Barnet | 1.42% | 2,250 |
| 3 | Overall London | 1.03% | 31,554 |
| 4 | City of Edinburgh | 0.61% | 1,228 |
| 5 | Brighton and Hove | 0.53% | 585 |
| 6 | Havering | 0.52% | 698 |
| 7 | City of Bristol | 0.43% | 976 |
| Overall UK | 0.39% | 154,310 | |
| 8 | Sheffield | 0.38% | 970 |
| 9 | Luton | 0.37% | 359 |
| 10 | Newcastle upon Tyne | 0.35% | 382 |
| 11 | Nottingham | 0.34% | 396 |
| 12 | Cardiff | 0.31% | 517 |
| 13 | Leeds | 0.30% | 1,433 |
| 14 | Milton Keynes | 0.28% | 1,061 |
| 15 | Derby | 0.27% | 389 |
| 16 | Sunderland | 0.26% | 338 |
| 17 | Manchester | 0.24% | 448 |
| 18 | Glasgow City | 0.23% | 539 |
| 19 | Liverpool | 0.21% | 365 |
| 20 | Wolverhampton | 0.20% | 253 |
| 21 | Belfast | 0.18% | 291 |
| 22 | Stoke on Trent | 0.18% | 236 |
| 23 | Birmingham | 0.18% | 1,360 |
| 24 | Leicester | 0.18% | 325 |
| 25 | Plymouth | 0.17% | 234 |
| 26 | Peterborough | 0.13% | 296 |
Data compiled by RAND from an analysis of Vehicle Statistics Database (VSD) records by local authority from 2020 quarter 2 (Q2)
[*] ULEVs include pure electric, hybrids and plug in hybrids; figures relate to privately owned vehicles


Discussion about this post