


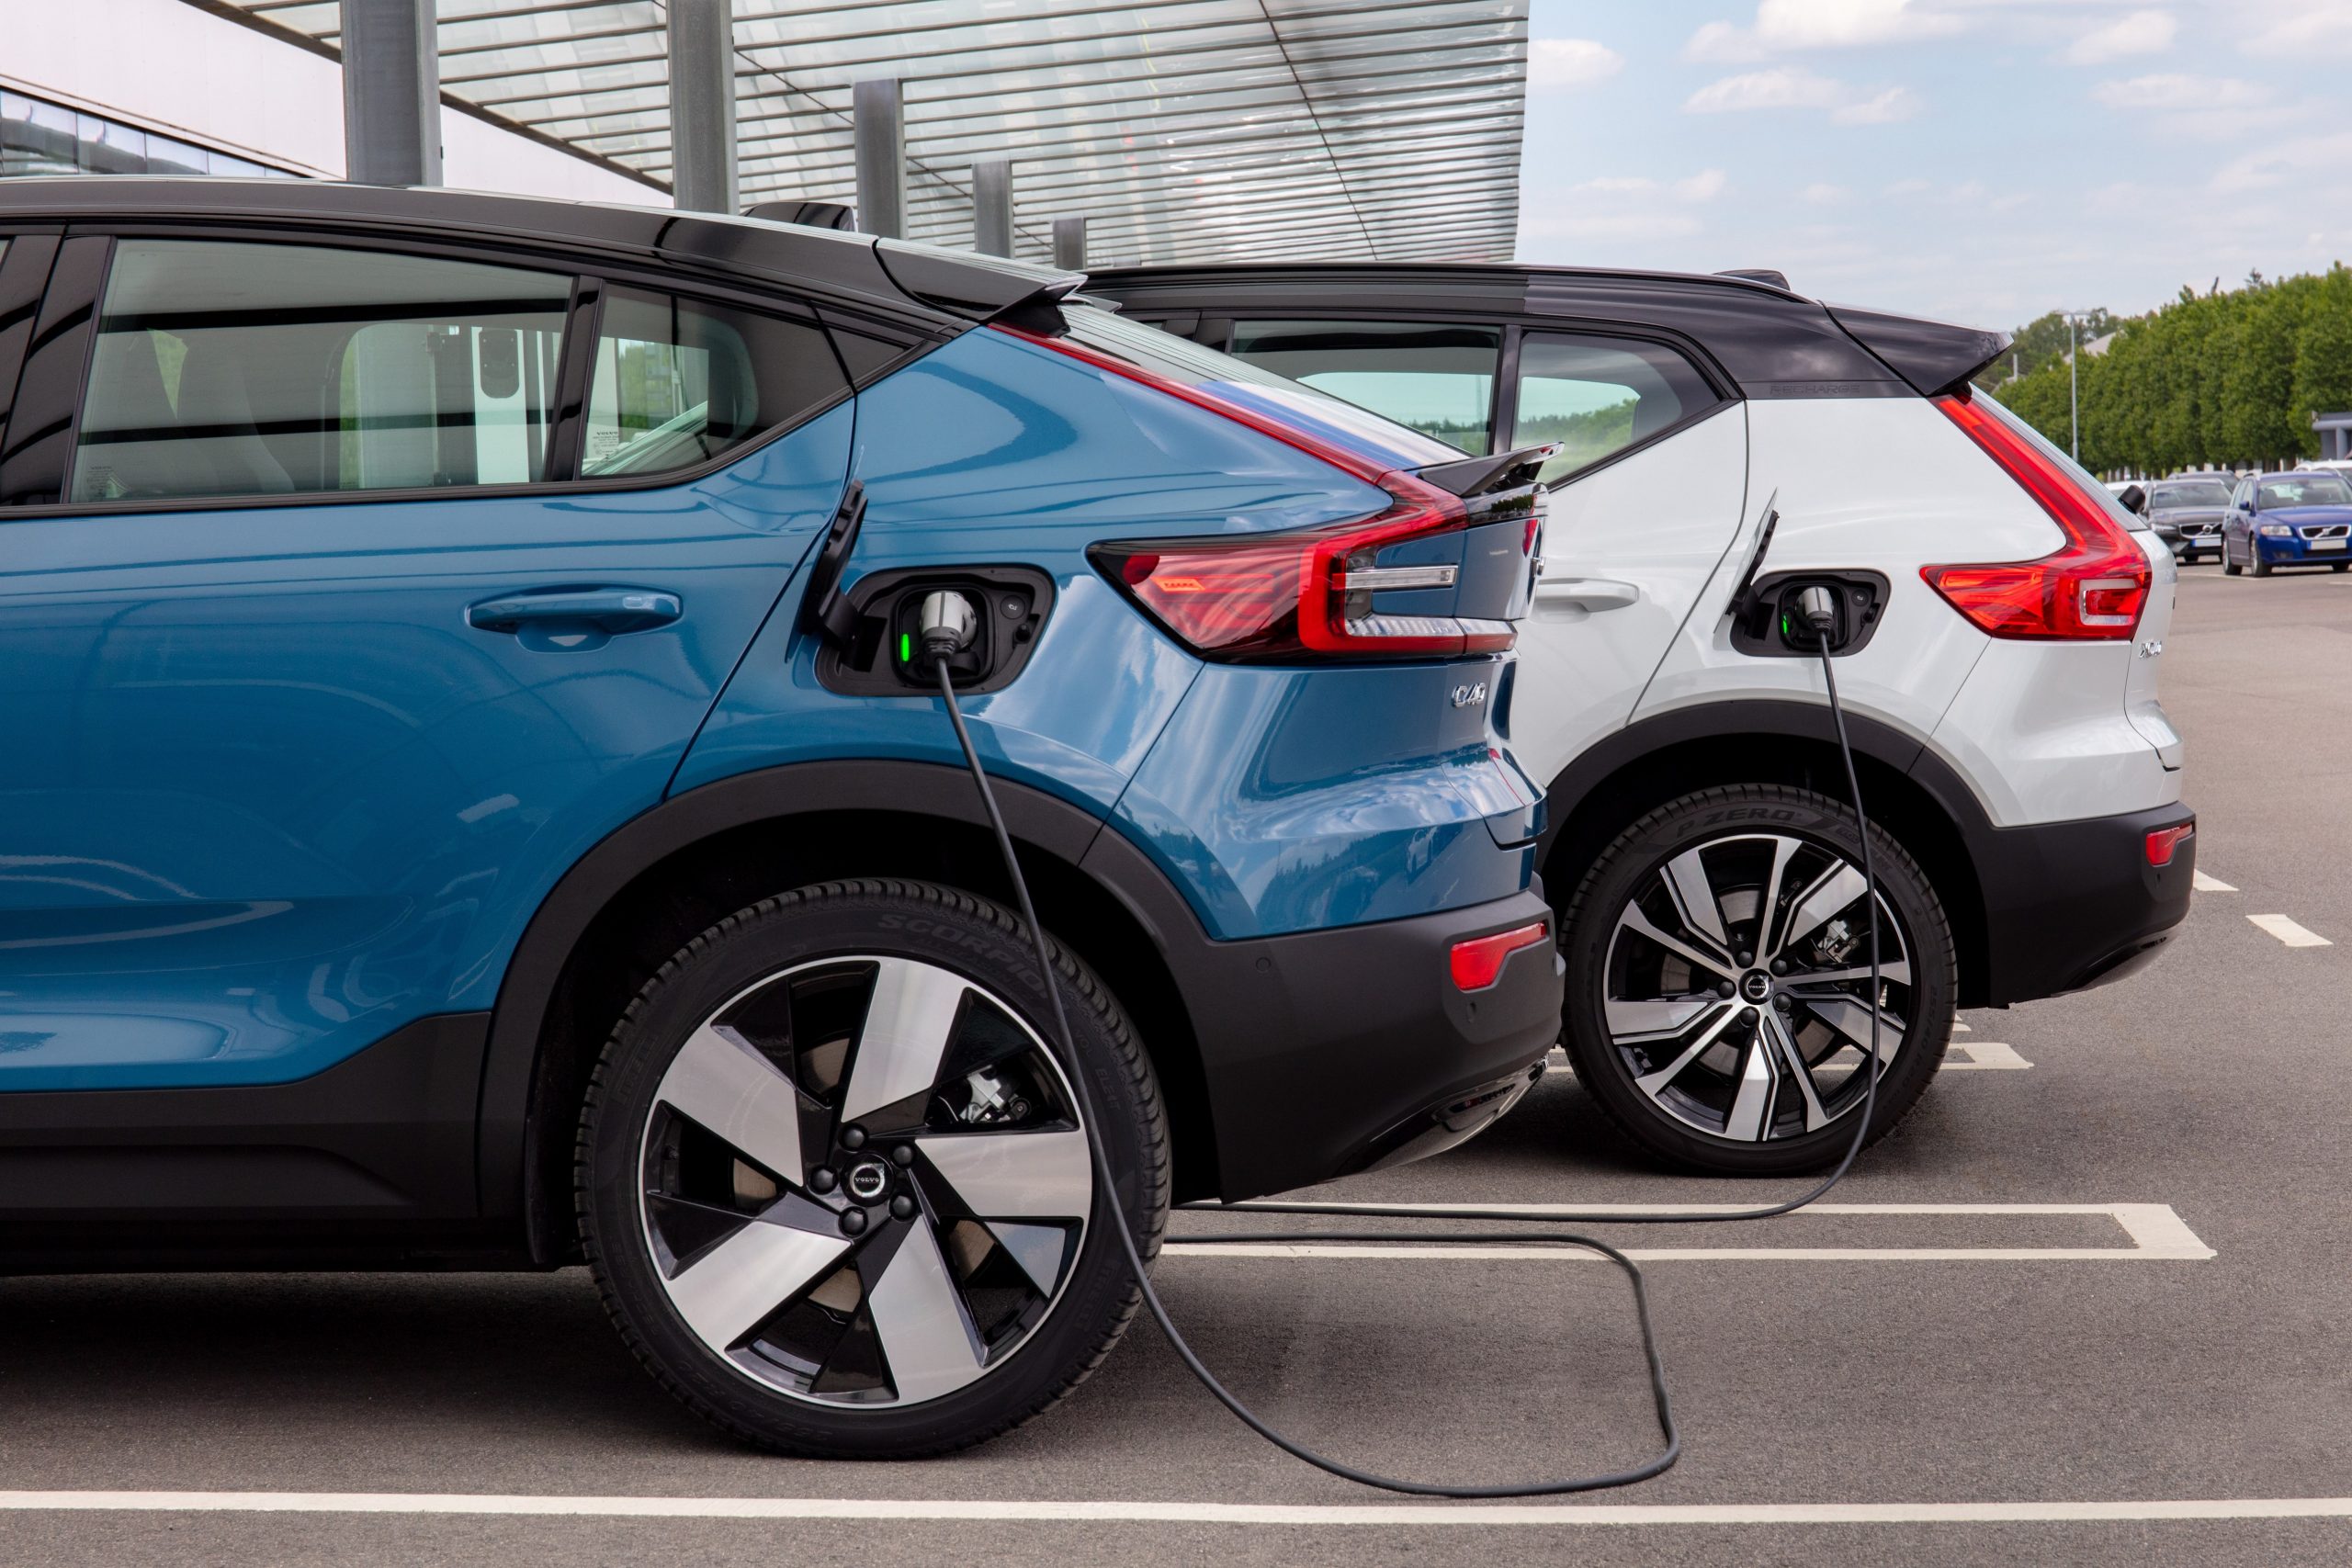
Demand for Volvo's Recharge pure electric cars remains robust, the company has announced.
Recharge cars accounted for 21.5%of total sales in July, while fully electric vehicles such as the XC40 stood at 3.5%. For the full year 2022, the target remains of having a double-digit share of fully electric cars.
In Europe, where Recharge cars accounted for 39.9% of total sales in July, the fully-electric segment registered a 69% growth year-to-date.
In the US, where Recharge models make up 14% of the total sales, fully-electric cars have seen a 21% growth YTD.
Volvo noted that July sales continued to be affected by supply constraints being carried over from previous months due to Covid-related lockdowns in China. This particularly affected retail deliveries of Recharge cars during the month and is expected to continue to affect its retail sales into the current quarter.
Nevertheless, the Swedish automaker stressed that it is seeing a marked improvement in the stabilisation of its supply chain, with July confirming the positive production trend as seen in the previous month. Provided this normalisation continues, the company expects production to “progressively increase” in the coming months.
On the back of this expected improvement, Volvo anticipates retail sales to be flat or slightly lower for the full year 2022, compared with volumes in 2021.
Bucking this trend, however, China saw total sales go up by 6.4% in July, with fully-electric cars witnessing a whopping 280% growth year-to-date. This enabled Volvo to record a 96% global increase in BEV sales.
| July | January-July (YTD) |
|||||
| 2022 | 2021 | Change | 2022 | 2021 | Change | |
| Europe | 15,893 | 22,408 | –29.1% | 135,663 | 189,230 | -28.3% |
| Recharge | 6,344 | 9,663 | -34.3% | 64,890 | 77,833 | -16.6% |
| – Plug-in hybrid | 5,350 | 8,531 | -37.3% | 50,842 | 69,523 | -26.9% |
| – Fully electric | 994 | 1,132 | -12.2% | 14,048 | 8,310 | 69.0% |
| China | 15,487 | 14,550 | 6.4% | 85,720 | 109,802 | –21.9% |
| Recharge | 815 | 1,112 | -26.7% | 5,857 | 5,245 | 11.7% |
| – Plug-in hybrid | 473 | 1,074 | -56.0% | 4,629 | 4,924 | -6.0% |
| – Fully electric | 342 | 38 | 800.0% | 1,228 | 321 | 282.6% |
| US | 6,868 | 11,575 | –40.7% | 57,453 | 75,329 | –23.7% |
| Recharge | 961 | 2,275 | -57.8% | 16,866 | 12,349 | 36.6% |
| – Plug-in hybrid | 867 | 1,374 | -36.9% | 12,961 | 9,122 | 42.1% |
| – Fully electric | 94 | 901 | -89.6% | 3,905 | 3,227 | 21.0% |
| Other | 6,416 | 8,350 | –23.2% | 57,129 | 63,279 | –9.7% |
| Recharge | 1,476 | 1,475 | 0.1% | 15,944 | 12,893 | 23.7% |
| – Plug-in hybrid | 1,323 | 1,411 | -6.2% | 11,322 | 12,606 | -10.2% |
| – Fully electric | 153 | 64 | 139.1% | 4,622 | 287 | 1510.5% |
| Total | 44,664 | 56,883 | –21.5% | 335,965 | 437,640 | -23.2% |
| Recharge | 9,596 | 14,525 | -33.9% | 103,557 | 108,320 | -4.4% |
| – Plug-in hybrid | 8,013 | 12,390 | -35.3% | 79,754 | 96,175 | -17.1% |
| – Fully electric | 1,583 | 2,135 | -25.9% | 23,803 | 12,145 | 96.0% |


Discussion about this post